Posts Tagged ‘NSX’

Load Balancing Ansible Tower Using NSX

February 1, 2020

Disclamer: this configuration is not validated by either VMware or Red Hat. Make sure it is applicable to your use case and thoroughly test before implementing in production.

Overview

If you landed on this page I trust you already know what Ansible is. It’s a great configuration management tool centred around using YAML to describe the desired state configuration of your various infrastructure components. This desired state is captured in what Ansible calls playbooks, which once written, can then be used in a repeatable way to deploy brand new components or enforce configuration on already deployed ones.

Ansible can be installed and used from CLI, which is usually a good starting point. If you have multiple people using Ansible in your organization, you can also deploy AWX. It’s a free GUI add-on to Ansible, which makes managing concurrent user access to Ansible easier, by adding projects, schedules and credentials management. On top of that there is Ansible Tower. Ansible Tower is a paid version of AWX and gives you additional enterprise features and services like clustering, product support, validated upgrade paths, etc. In this article we will be focusing on Ansible Tower version of the product.

Also worth mentioning that this configuration will be based on Ansible Tower cluster feature, which lets you run all nodes as active/active. Prior to version 3.1 it was called redundancy and worked only in active/passive mode. Redundancy feature is deprecated and is outside the scope of this blog post.

Topology

Deploying multiple Ansible Tower nodes in a cluster already gives you redundancy. If one of the nodes fails you can connect to another node, by just changing your browser URL. The benefit of having a load balancer is that you have one URL you can hit and if a node goes down, such situation is handled by load balancer automatically.

In this example we will be deploying a VMware NSX load-balancer in the following topology:

Configuration

Deploying an NSX load-balancer for HTTPS port 443 is simple, you can find numerous examples of how to create application profiles, monitors, pools and VIPs in official VMware documentation or out on the Internet. But with Ansible there’s one catch. If you try to use the default HTTPS monitor that NSX load balancer comes with, you will find HTTP 400 code in Ansible nginx logs:

10.20.30.40 - - [20/Jan/2020:04:50:19 +0000] "GET / HTTP/1.0" 400 3786 "-" "-" "-"
10.20.30.40 - - [20/Jan/2020:04:50:24 +0000] "GET / HTTP/1.0" 400 3786 "-" "-" "-"
10.20.30.40 - - [20/Jan/2020:04:50:29 +0000] "GET / HTTP/1.0" 400 3786 "-" "-" "-"

And an error in NSX load balancer health check:

As it turns out, when you make a HTTP request to Ansible Tower, specifying HTTP “Host” header is a requirement. Host header simply contains the hostname of the server you’re making a request to. Browsers add this header automatically, that’s why you’re not going to see any errors, when accessing Ansible Tower Using Firefox or Chrome. But NSX doesn’t add this header to the monitor checks by default, which makes Ansible Tower upset.

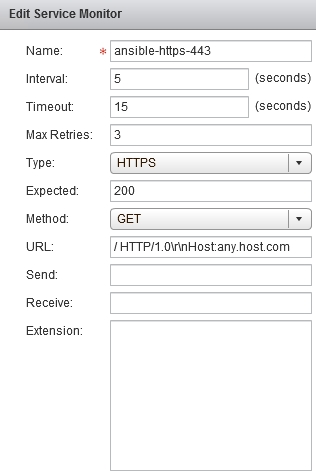
Here is the trick you need to do to make Tower happy:

Now nginx logs show success code 200:

10.20.30.40 - - [21/Jan/2020:22:54:42 +0000] "GET / HTTP/1.0" 200 11337 "-" "-" "-"
10.20.30.40 - - [21/Jan/2020:22:54:47 +0000] "GET / HTTP/1.0" 200 11337 "-" "-" "-"
10.20.30.40 - - [21/Jan/2020:22:54:52 +0000] "GET / HTTP/1.0" 200 11337 "-" "-" "-"

Load balancer health check is successful:

And pool members are up and reachable:

Note: technically the host header should contain the hostname of the Tower node we’re making a health check on. But since NSX monitor is configured per pool and not per pool member, we have to use a fake hostname “any.host.com” as a workaround. When I was testing it, Tower didn’t complain.

Reference

Even though I said that the rest of the load-balancer configuration is standard, I still think having screenshots for reference is helpful if you need to validate configuration. So find the full list of settings below.

Screenshot 1: Application Profile

Screenshot 2: Service Monitor
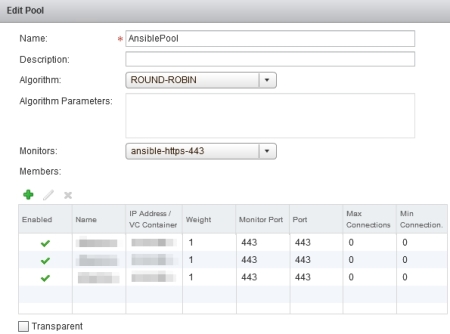
Screenshot 3: Pool

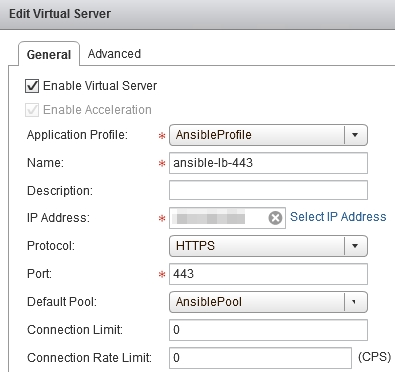
Screenshot 4: Virtual Server

Reminder: Disable Firewall on NSX ECMP Edge

October 15, 2019

ECMP and Stateful Services

It’s not new, this topic has already been discussed many times before, examples are here, here, here and here. When NSX Edges are configured in ECMP mode, none of the stateful services like VPN, NAT or Load Balancing are supported.

From NSX Design Guide:

In ECMP mode, only routing service is available. Stateful services cannot be supported due to asymmetric routing inherent in ECMP-based forwarding.

Even if you didn’t read documentation, but have networking skills, you’d know that protocols like NAT need to track network session state and even if you configure the same NAT rule on all of your ECMP-enabled edges, it won’t work, because due to ECMP, traffic can flow through one ESG on ingress and another ESG on egress. Since NAT tables are not synchronized, ESGs won’t be able to find the corresponding network flow in translation table and will drop the traffic.

ECMP and Firewall

But there’s another issue that doesn’t always come across or simply get forgotten about. You can deploy ESGs in ECMP mode, not configure any of the stateful services like VPN, NAT or LB, but still get network communication issues. Why? Because when you deploy an ESG, you always end up with firewall in enabled state. Firewall is also considered a stateful service.

From VVD 5.1 documentation:

SDDC-VISDN-032: For all ESGs deployed as ECMP North-South routers, disable the firewall. Use of ECMP on the ESGs is a requirement. Leaving the firewall enabled, even in allow all traffic mode, results in sporadic network connectivity. Services such as NAT and load balancing cannot be used when the firewall is disabled.

In fact, firewall is what actually tracks sessions and drops packets that don’t match existing network flows, not NAT itself. That’s also the reason why services like NAT and LB don’t work without firewall being enabled.

It often throws people off, because even having no rules in the firewall and setting default policy to accept will not prevent this issue from happening.

Demo

Here is a quick demonstration. I’m trying to establish an SSH session to a VM connected to a DLR behind two ESGs in ECMP mode.

I’m showing packet debug on both ESGs using the following command:

> debug packet display follow interface vNic_1 port_22

As you can see ingress traffic goes through E1 and egress traffic goes through E2:

E1: Packet Capture

E2: Packet Capture

Since session originated on E1, E2 interprets packets as invalid and immediately drops them:

From NSX Troubleshooting Guide:

Check for an incrementing value of a DROP invalid rule in the POST_ROUTING section of the show firewall command. Typical reasons include:

  • Asymmetric routing issues

Conclusion

It’s easy to end up in this situation, because firewall is enabled by default on a newly deployed ESG. And it’s hard to troubleshoot this issue, since it’s not quite obvious what’s actually going on unless you’ve already worked with ECMP before. So the best advice in this case is just to remember, if you want to use ECMP in NSX, make sure to disable firewall on ECMP-enabled ESGs. Use distributed firewall (DFW) instead.

Run CLI Commands on NSX Manager Using REST API

August 29, 2019

Over the last few years I’ve had a chance to work with NSX-V REST APIs in many different shapes and forms. Directly from vRealize Orchestrator and PowerShell/PowerNSX, indirectly from vRealize Automation or simply by making calls from Postman, which is sometimes required during NSX deployment and upgrades.

To date I haven’t been able to find any gaps in the API and can say only good things about it. It is very well documented. You can find detailed descriptions of all requests in NSX API Guide PDF or interactively browse it in API explorer on https://code.vmware.com.

But at the end of the day, NSX REST API is only a subset of what you can do from CLI and there are situations where it’s not sufficient. I’ll give you an example. Let’s say you want to know how much storage is available on NSX Manager appliance log partition. There’s a REST API call, which will give you a response similar to this:

GET https://nsxm/api/1.0/appliance-management/system/storageinfo

<storageInfo>
  <totalStorage>86G</totalStorage>
  <usedStorage>22G</usedStorage>
  <freeStorage>64G</freeStorage>
  <usedPercentage>25</usedPercentage>
</storageInfo>

As you can see, it answers the question of how much total space is available on the appliance, but doesn’t provide a full per partition breakdown available from the CLI via “show filesystem”:

Filesystem      Size  Used Avail Use% Mounted on
/dev/root       5.6G  1.2G  4.1G  23% /
tmpfs           7.9G  232K  7.9G   1% /run
devtmpfs        7.9G     0  7.9G   0% /dev
/dev/sda6        44G   19G   24G  44% /common
/dev/loop0       16G   45M   15G   1% /common/vdisk_mnt

So what are the options here? What is not widely known is that you can use NSX central command-line interface to remotely invoke appliance CLI commands using REST API.

Invoking CLI Commands

NSX REST API has a handy POST call https://nsxm/api/1.0/nsx/cli?action=execute. All you need to provide in addition to Authorization credentials using “Basic Auth” option is the following body in XML format:

<nsxcli>
  <command>show filesystem</command>
</nsxcli>

In response you will get a body in “text/plain” format, which is the only drawback of this method. You will need to parse the response in your scripting language of choice. In PowerShell, if you made the original call using Invoke-WebRequest cmdlet and saved it into the $response variable, it can look something like this:

$responseRows = $response.Content -split "`n"
foreach($row in $responseRows) {
  if($row -Like "*/dev/sda6*") {
    $pctUsed = $row.Split(" ",[StringSplitOptions]"RemoveEmptyEntries")[4]
    $pctUsedValue = $pctUsed.Substring(0, $pctUsed.Length-1)
    Write-Host "Space utilization on the log partition is $pctUsed."
    break
  }
}

Conclusion

For most use cases NSX REST API provides all the necessary information about NSX component configuration in structured JSON or XML format. This method is more of an exception rather than a rule, but it’s a nice tool to have in your tool belt, when you run out of options.

NSX Optimistic Locking and PowerNSX

August 3, 2019

Recently, when working on some NSX-V automation, I came across an interesting issue, which I want to discuss here, since there’s almost no information on the Internet (while I’m writing this), that would help to solve it or even point you in the right direction. It has to do with PowerNSX and Optimistic Locking in NSX (which technically is not even a locking mechanism), but let’s start from the beginning.

If you ever used PowerNSX module to automate NSX via PowerShell you noticed that most of the code examples use pipelines to run PowerNSX cmdlets. So instead of using variables, like so:

$Edge = Get-NsxEdge vRA7 _ edge
$LoadBalancer = Get-NsxLoadBalancer -Edge $Edge
Set-NsxLoadBalancer -LoadBalancer $LoadBalancer -enabled
New-NsxLoadBalancerApplicationProfile -LoadBalancer $LoadBalancer -Name $WebAppProfileName -Type $VipProtocol –SslPassthrough

all commands are run this way instead:

Get-NsxEdge vRA7_edge | Get-NsxLoadBalancer | Set-NsxLoadBalancer -enabled
Get-NsxEdge vRA7_dge | Get-NsxLoadBalancer | New-NsxLoadBalancerApplicationProfile -Name $WebAppProfileName -Type $VipProtocol –SslPassthrough

What’s the difference you may ask, besides the fact the the second variant is slower, because you retrieve edge and load balancer objects multiple times, instead of once, compared to the first variant? There’s actually a strong reason for it. More specifically, it is the following error that you gonna get if you don’t use pipelines:

invoke-nsxwebrequest : Invoke-NsxWebRequest : The NSX API response received indicates a failure. 409 : Conflict : Response Body: {“errorCode”:101, “details”:”Concurrent object access error. Refresh UI or fetch the latest copy of the object and retry the operation.”, “rootCauseString”:null, “moduleName”:null, “errorData”:null}

See, NSX uses Optimistic Locking (yes, there’s Pessimistic Locking as well) to handle concurrency. Its purpose is to make sure that if you’re making a change to an object in NSX you are aware of its current state. In the above example, you saved load balancer into a variable, changed the load balancer state to enabled and then tried to create an application profile, supplying load balancer saved in a variable as a parameter to the cmdlet. But the load balancer (and edge) state has changed and you’re basically using an old (stale) version of the object. You either have to retrieve the current state of the object again or avoid this issue all together by simply using pipelines and retrieve the up-to-date version of the object with every call.

Read this article if you want to know more about Optimistic Locking:

If you found this useful, please leave a comment, smash that like button and hit notification bell to not miss new blog posts ever again.